App.Metrics是一款开源的支持.NET Core的监控插件。
基于 AppMetrics 实现统一性能监控
优秀的平台需要有强大的性能监控
influxdb
1、到官网下载influxdb,下载Windows 64位版本
2、解压之后放到你想要放置的位置,然后编辑influxdb.conf配置文件
[meta]
# Where the metadata/raft database is stored
dir = “D:/BaseService/influxdb/meta”
[data]
# The directory where the TSM storage engine stores TSM files.
dir = “D:/BaseService/influxdb/data”
# The directory where the TSM storage engine stores WAL files.
wal-dir = “D:/BaseService/influxdb/wal”
3、启动:
influxd -config influxdb.conf4、新开一个命令行窗口,连接influxdb,然后创建一个database
influx -host 127.0.0.1 -port 8086 -username "admin" -password "admin"
create database "AppMetriceDB"
show databases
5、安装influxd为本地服务
使用nssm.exe将influxdb安装为本地服务,具体方法参照http://richardn.ca/2019/01/04/installing-influxdb-on-windows/
172.16.161.50:8086
AppMetriceDB
admin/admin
grafana
1、下载Windows版本(64位)
2、直接运行grafana-server.exe即可,默认绑定3000端口号
3、浏览器打开serverip:3000,使用默认账号admin/admin(账号密码都是admin)登录
4、为InfluxDB添加数据源
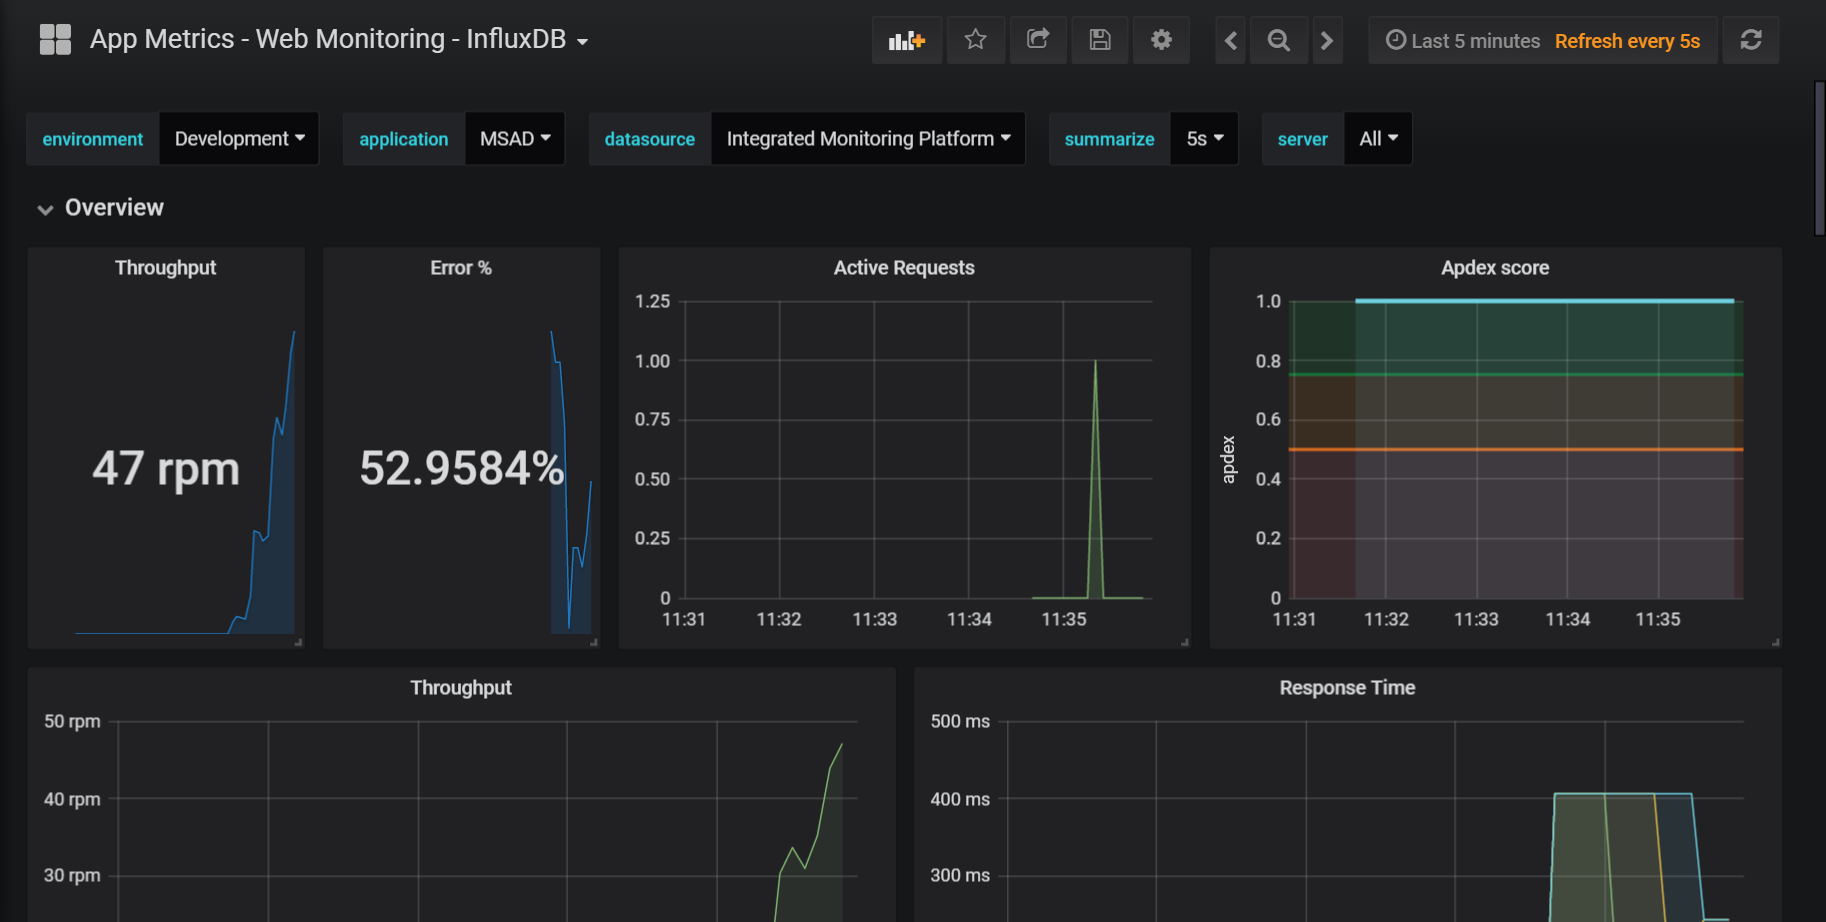
5、为Grafana添加InfluxDB的Dashboard仪表盘的JSON文件
这里有两种方式:一种是直接给URL=>https://grafana.com/dashboards/2125 另一种是我们手动下载这个URL的JSON,然后把JSON粘贴过来。
6、安装grafana-piechart-panel插件
在grafana的安装目录\bin目录运行 grafana-cli plugins install grafana-piechart-panel 命令,重新启动Grafana服务
172.16.161.50:3000
admin/admin
Grafana Dashboard Json文件
{
"__inputs": [],
"__requires": [
{
"type": "grafana",
"id": "grafana",
"name": "Grafana",
"version": "4.2.0"
},
{
"type": "panel",
"id": "grafana-piechart-panel",
"name": "Pie Chart",
"version": "1.1.4"
},
{
"type": "panel",
"id": "graph",
"name": "Graph",
"version": ""
},
{
"type": "panel",
"id": "singlestat",
"name": "Singlestat",
"version": ""
},
{
"type": "panel",
"id": "table",
"name": "Table",
"version": ""
}
],
"annotations": {
"list": []
},
"description": "Dashboard to visualize metrics captured by App Metrics ASP.NET Core Middleware 1.2.0, tested with App.Metrics.Extensions.Reporting.InfluxDB 1.2.0 - http://app-metrics.io/",
"editable": true,
"gnetId": 2125,
"graphTooltip": 1,
"hideControls": false,
"id": null,
"links": [],
"refresh": "5s",
"rows": [
{
"collapse": true,
"height": "250",
"panels": [
{
"cacheTimeout": null,
"colorBackground": false,
"colorValue": false,
"colors": [
"rgba(245, 54, 54, 0.9)",
"rgba(237, 129, 40, 0.89)",
"rgba(50, 172, 45, 0.97)"
],
"datasource": "$datasource",
"editable": true,
"error": false,
"format": "rpm",
"gauge": {
"maxValue": 100,
"minValue": 0,
"show": false,
"thresholdLabels": false,
"thresholdMarkers": true
},
"id": 8,
"interval": "",
"links": [],
"mappingType": 1,
"mappingTypes": [
{
"name": "value to text",
"value": 1
},
{
"name": "range to text",
"value": 2
}
],
"maxDataPoints": 100,
"nullPointMode": "connected",
"nullText": null,
"postfix": "",
"postfixFontSize": "50%",
"prefix": "",
"prefixFontSize": "50%",
"rangeMaps": [
{
"from": "null",
"text": "N/A",
"to": "null"
}
],
"span": 2,
"sparkline": {
"fillColor": "rgba(31, 118, 189, 0.18)",
"full": true,
"lineColor": "rgb(31, 120, 193)",
"show": true
},
"targets": [
{
"dsType": "influxdb",
"groupBy": [
{
"params": [
"$interval"
],
"type": "time"
},
{
"params": [
"null"
],
"type": "fill"
}
],
"measurement": "application.httprequests__transactions",
"policy": "default",
"refId": "A",
"resultFormat": "time_series",
"select": [
[
{
"params": [
"rate1m"
],
"type": "field"
},
{
"params": [],
"type": "last"
}
]
],
"tags": [
{
"key": "app",
"operator": "=~",
"value": "/^$application$/"
},
{
"condition": "AND",
"key": "env",
"operator": "=~",
"value": "/^$environment$/"
},
{
"condition": "AND",
"key": "server",
"operator": "=~",
"value": "/^$server$/"
}
]
}
],
"thresholds": "",
"title": "吞吐量",
"type": "singlestat",
"valueFontSize": "80%",
"valueMaps": [
{
"op": "=",
"text": "N/A",
"value": "null"
}
],
"valueName": "current"
},
{
"cacheTimeout": null,
"colorBackground": false,
"colorValue": false,
"colors": [
"rgba(50, 172, 45, 0.97)",
"rgba(237, 129, 40, 0.89)",
"rgba(245, 54, 54, 0.9)"
],
"datasource": "$datasource",
"decimals": 4,
"editable": true,
"error": false,
"format": "percent",
"gauge": {
"maxValue": 100,
"minValue": 0,
"show": false,
"thresholdLabels": false,
"thresholdMarkers": true
},
"id": 6,
"interval": null,
"links": [],
"mappingType": 1,
"mappingTypes": [
{
"name": "value to text",
"value": 1
},
{
"name": "range to text",
"value": 2
}
],
"maxDataPoints": 100,
"nullPointMode": "connected",
"nullText": null,
"postfix": "",
"postfixFontSize": "50%",
"prefix": "",
"prefixFontSize": "50%",
"rangeMaps": [
{
"from": "",
"text": "",
"to": ""
}
],
"span": 2,
"sparkline": {
"fillColor": "rgba(31, 118, 189, 0.18)",
"full": true,
"lineColor": "rgb(31, 120, 193)",
"show": true
},
"targets": [
{
"dsType": "influxdb",
"groupBy": [],
"measurement": "application.httprequests__one_minute_error_percentage_rate",
"policy": "default",
"query": "SELECT \"value\" FROM \"application.httprequests__percentage_error_requests\" WHERE $timeFilter",
"rawQuery": false,
"refId": "A",
"resultFormat": "time_series",
"select": [
[
{
"params": [
"value"
],
"type": "field"
}
]
],
"tags": [
{
"key": "env",
"operator": "=~",
"value": "/^$environment$/"
},
{
"condition": "AND",
"key": "app",
"operator": "=~",
"value": "/^$application$/"
},
{
"condition": "AND",
"key": "server",
"operator": "=~",
"value": "/^$server$/"
}
]
}
],
"thresholds": "",
"title": "错误 %",
"type": "singlestat",
"valueFontSize": "80%",
"valueMaps": [
{
"op": "=",
"text": "0%",
"value": "null"
}
],
"valueName": "current"
},
{
"aliasColors": {},
"bars": false,
"datasource": "$datasource",
"editable": true,
"error": false,
"fill": 2,
"id": 13,
"interval": "$summarize",
"legend": {
"avg": false,
"current": false,
"max": false,
"min": false,
"show": false,
"total": false,
"values": false
},
"lines": true,
"linewidth": 1,
"links": [],
"nullPointMode": "connected",
"percentage": false,
"pointradius": 5,
"points": false,
"renderer": "flot",
"seriesOverrides": [],
"span": 4,
"stack": false,
"steppedLine": false,
"targets": [
{
"alias": "",
"dsType": "influxdb",
"groupBy": [
{
"params": [
"$interval"
],
"type": "time"
},
{
"params": [
"null"
],
"type": "fill"
}
],
"measurement": "application.httprequests__active",
"policy": "default",
"refId": "A",
"resultFormat": "time_series",
"select": [
[
{
"params": [
"value"
],
"type": "field"
},
{
"params": [],
"type": "last"
}
]
],
"tags": [
{
"key": "env",
"operator": "=~",
"value": "/^$environment$/"
},
{
"condition": "AND",
"key": "app",
"operator": "=~",
"value": "/^$application$/"
},
{
"condition": "AND",
"key": "server",
"operator": "=~",
"value": "/^$server$/"
}
]
}
],
"thresholds": [],
"timeFrom": null,
"timeShift": null,
"title": "活动的请求",
"tooltip": {
"msResolution": false,
"shared": true,
"sort": 0,
"value_type": "individual"
},
"type": "graph",
"xaxis": {
"mode": "time",
"name": null,
"show": true,
"values": []
},
"yaxes": [
{
"format": "short",
"label": null,
"logBase": 1,
"max": null,
"min": null,
"show": true
},
{
"format": "short",
"label": null,
"logBase": 1,
"max": null,
"min": null,
"show": true
}
]
},
{
"aliasColors": {
"application.httprequests__apdex.last": "#6ED0E0"
},
"bars": false,
"datasource": "$datasource",
"editable": true,
"error": false,
"fill": 1,
"height": "",
"id": 7,
"interval": "$summarize",
"legend": {
"avg": false,
"current": false,
"max": false,
"min": false,
"show": false,
"total": false,
"values": false
},
"lines": true,
"linewidth": 3,
"links": [],
"nullPointMode": "connected",
"percentage": false,
"pointradius": 5,
"points": false,
"renderer": "flot",
"seriesOverrides": [],
"span": 4,
"stack": false,
"steppedLine": false,
"targets": [
{
"dsType": "influxdb",
"groupBy": [
{
"params": [
"$interval"
],
"type": "time"
},
{
"params": [
"null"
],
"type": "fill"
}
],
"measurement": "application.httprequests__apdex",
"policy": "default",
"refId": "A",
"resultFormat": "time_series",
"select": [
[
{
"params": [
"score"
],
"type": "field"
},
{
"params": [],
"type": "last"
}
]
],
"tags": [
{
"key": "app",
"operator": "=~",
"value": "/^$application$/"
},
{
"condition": "AND",
"key": "env",
"operator": "=~",
"value": "/^$environment$/"
},
{
"condition": "AND",
"key": "server",
"operator": "=~",
"value": "/^$server$/"
}
]
}
],
"thresholds": [
{
"colorMode": "critical",
"fill": true,
"line": true,
"op": "lt",
"value": 0.5
},
{
"colorMode": "warning",
"fill": true,
"line": true,
"op": "gt",
"value": 0.5
},
{
"colorMode": "ok",
"fill": true,
"line": true,
"op": "gt",
"value": 0.75
}
],
"timeFrom": null,
"timeShift": null,
"title": "性能指数",
"tooltip": {
"msResolution": false,
"shared": true,
"sort": 0,
"value_type": "individual"
},
"type": "graph",
"xaxis": {
"mode": "time",
"name": null,
"show": true,
"values": []
},
"yaxes": [
{
"format": "short",
"label": "apdex",
"logBase": 1,
"max": "1",
"min": "0",
"show": true
},
{
"format": "short",
"label": null,
"logBase": 1,
"max": null,
"min": null,
"show": false
}
]
},
{
"aliasColors": {},
"bars": false,
"datasource": "$datasource",
"editable": true,
"error": false,
"fill": 1,
"height": "350",
"id": 1,
"interval": "$summarize",
"legend": {
"avg": false,
"current": true,
"max": false,
"min": false,
"show": true,
"total": false,
"values": true
},
"lines": true,
"linewidth": 1,
"links": [],
"nullPointMode": "connected",
"percentage": false,
"pointradius": 5,
"points": false,
"renderer": "flot",
"seriesOverrides": [],
"span": 6,
"stack": false,
"steppedLine": false,
"targets": [
{
"alias": "$col",
"dsType": "influxdb",
"groupBy": [
{
"params": [
"$interval"
],
"type": "time"
},
{
"params": [
"null"
],
"type": "fill"
}
],
"measurement": "application.httprequests__transactions",
"policy": "default",
"refId": "A",
"resultFormat": "time_series",
"select": [
[
{
"params": [
"rate1m"
],
"type": "field"
},
{
"params": [],
"type": "last"
},
{
"params": [
"1 min rate"
],
"type": "alias"
}
],
[
{
"params": [
"rate5m"
],
"type": "field"
},
{
"params": [],
"type": "last"
},
{
"params": [
"5 min rate"
],
"type": "alias"
}
],
[
{
"params": [
"rate15m"
],
"type": "field"
},
{
"params": [],
"type": "last"
},
{
"params": [
"15 min rate"
],
"type": "alias"
}
]
],
"tags": [
{
"key": "env",
"operator": "=~",
"value": "/^$environment$/"
},
{
"condition": "AND",
"key": "app",
"operator": "=~",
"value": "/^$application$/"
},
{
"condition": "AND",
"key": "server",
"operator": "=~",
"value": "/^$server$/"
}
]
}
],
"thresholds": [],
"timeFrom": null,
"timeShift": null,
"title": "吞吐量",
"tooltip": {
"msResolution": false,
"shared": true,
"sort": 0,
"value_type": "individual"
},
"type": "graph",
"xaxis": {
"mode": "time",
"name": null,
"show": true,
"values": []
},
"yaxes": [
{
"format": "rpm",
"label": null,
"logBase": 1,
"max": null,
"min": null,
"show": true
},
{
"format": "short",
"label": null,
"logBase": 1,
"max": null,
"min": null,
"show": true
}
]
},
{
"aliasColors": {},
"bars": false,
"datasource": "$datasource",
"editable": true,
"error": false,
"fill": 1,
"height": "350",
"id": 2,
"interval": "$summarize",
"legend": {
"alignAsTable": false,
"avg": false,
"current": false,
"max": false,
"min": false,
"rightSide": false,
"show": true,
"total": false,
"values": false
},
"lines": true,
"linewidth": 1,
"links": [],
"nullPointMode": "connected",
"percentage": false,
"pointradius": 5,
"points": false,
"renderer": "flot",
"seriesOverrides": [],
"span": 6,
"stack": false,
"steppedLine": false,
"targets": [
{
"alias": "$col",
"dsType": "influxdb",
"groupBy": [
{
"params": [
"$interval"
],
"type": "time"
},
{
"params": [
"null"
],
"type": "fill"
}
],
"measurement": "application.httprequests__transactions",
"policy": "default",
"refId": "A",
"resultFormat": "time_series",
"select": [
[
{
"params": [
"p95"
],
"type": "field"
},
{
"params": [],
"type": "last"
},
{
"params": [
"95th Percentile"
],
"type": "alias"
}
],
[
{
"params": [
"p98"
],
"type": "field"
},
{
"params": [],
"type": "last"
},
{
"params": [
"98th Percentile"
],
"type": "alias"
}
],
[
{
"params": [
"p99"
],
"type": "field"
},
{
"params": [],
"type": "last"
},
{
"params": [
"99th Percentile"
],
"type": "alias"
}
]
],
"tags": [
{
"key": "env",
"operator": "=~",
"value": "/^$environment$/"
},
{
"condition": "AND",
"key": "app",
"operator": "=~",
"value": "/^$application$/"
},
{
"condition": "AND",
"key": "server",
"operator": "=~",
"value": "/^$server$/"
}
]
}
],
"thresholds": [],
"timeFrom": null,
"timeShift": null,
"title": "响应时间",
"tooltip": {
"msResolution": false,
"shared": true,
"sort": 0,
"value_type": "individual"
},
"type": "graph",
"xaxis": {
"mode": "time",
"name": null,
"show": true,
"values": []
},
"yaxes": [
{
"format": "ms",
"label": null,
"logBase": 1,
"max": null,
"min": null,
"show": true
},
{
"format": "short",
"label": null,
"logBase": 1,
"max": null,
"min": null,
"show": true
}
]
},
{
"aliasColors": {},
"bars": false,
"datasource": "$datasource",
"editable": true,
"error": false,
"fill": 1,
"height": "",
"id": 9,
"interval": "$summarize",
"legend": {
"alignAsTable": true,
"avg": false,
"current": true,
"max": false,
"min": false,
"rightSide": true,
"show": false,
"total": false,
"values": true
},
"lines": true,
"linewidth": 1,
"links": [],
"nullPointMode": "connected",
"percentage": false,
"pointradius": 5,
"points": false,
"renderer": "flot",
"seriesOverrides": [],
"span": 6,
"stack": false,
"steppedLine": false,
"targets": [
{
"alias": "",
"dsType": "influxdb",
"groupBy": [
{
"params": [
"$interval"
],
"type": "time"
},
{
"params": [
"null"
],
"type": "fill"
}
],
"measurement": "application.httprequests__one_minute_error_percentage_rate",
"policy": "default",
"refId": "A",
"resultFormat": "time_series",
"select": [
[
{
"params": [
"value"
],
"type": "field"
},
{
"params": [],
"type": "last"
}
]
],
"tags": [
{
"key": "app",
"operator": "=~",
"value": "/^$application$/"
},
{
"condition": "AND",
"key": "env",
"operator": "=~",
"value": "/^$environment$/"
},
{
"condition": "AND",
"key": "server",
"operator": "=~",
"value": "/^$server$/"
}
]
}
],
"thresholds": [],
"timeFrom": null,
"timeShift": null,
"title": "错误率 %",
"tooltip": {
"msResolution": false,
"shared": true,
"sort": 0,
"value_type": "individual"
},
"type": "graph",
"xaxis": {
"mode": "time",
"name": null,
"show": true,
"values": []
},
"yaxes": [
{
"format": "percent",
"label": null,
"logBase": 1,
"max": "100",
"min": "0",
"show": true
},
{
"format": "short",
"label": null,
"logBase": 1,
"max": null,
"min": null,
"show": true
}
]
},
{
"aliasColors": {},
"bars": false,
"datasource": "$datasource",
"decimals": 2,
"editable": true,
"error": false,
"fill": 1,
"height": "250px",
"id": 3,
"interval": "$summarize",
"legend": {
"alignAsTable": true,
"avg": false,
"current": true,
"max": false,
"min": false,
"rightSide": true,
"show": true,
"total": false,
"values": true
},
"lines": true,
"linewidth": 1,
"links": [],
"nullPointMode": "connected",
"percentage": false,
"pointradius": 5,
"points": false,
"renderer": "flot",
"seriesOverrides": [],
"span": 6,
"stack": false,
"steppedLine": false,
"targets": [
{
"alias": "$col",
"dsType": "influxdb",
"groupBy": [
{
"params": [
"$interval"
],
"type": "time"
},
{
"params": [
"null"
],
"type": "fill"
}
],
"measurement": "application.httprequests__error_rate",
"policy": "default",
"refId": "A",
"resultFormat": "time_series",
"select": [
[
{
"params": [
"rate1m"
],
"type": "field"
},
{
"params": [],
"type": "last"
},
{
"params": [
"1min rate"
],
"type": "alias"
}
],
[
{
"params": [
"rate5m"
],
"type": "field"
},
{
"params": [],
"type": "last"
},
{
"params": [
"5min rate"
],
"type": "alias"
}
],
[
{
"params": [
"rate15m"
],
"type": "field"
},
{
"params": [],
"type": "last"
},
{
"params": [
"15min rate"
],
"type": "alias"
}
]
],
"tags": [
{
"key": "app",
"operator": "=~",
"value": "/^$application$/"
},
{
"condition": "AND",
"key": "env",
"operator": "=~",
"value": "/^$environment$/"
},
{
"condition": "AND",
"key": "server",
"operator": "=~",
"value": "/^$server$/"
}
]
}
],
"thresholds": [],
"timeFrom": null,
"timeShift": null,
"title": "错误率",
"tooltip": {
"msResolution": false,
"shared": true,
"sort": 2,
"value_type": "individual"
},
"type": "graph",
"xaxis": {
"mode": "time",
"name": null,
"show": true,
"values": []
},
"yaxes": [
{
"format": "rpm",
"label": null,
"logBase": 1,
"max": null,
"min": null,
"show": true
},
{
"format": "short",
"label": null,
"logBase": 1,
"max": null,
"min": null,
"show": true
}
]
},
{
"aliasColors": {},
"cacheTimeout": null,
"combine": {
"label": "Others",
"threshold": 0
},
"datasource": "$datasource",
"editable": true,
"error": false,
"fontSize": "80%",
"format": "percent",
"height": "250px",
"id": 4,
"interval": "",
"legend": {
"percentage": true,
"show": true,
"sort": null,
"sortDesc": null,
"values": true
},
"legendType": "Right side",
"links": [],
"maxDataPoints": 3,
"nullPointMode": "connected",
"pieType": "pie",
"span": 5,
"strokeWidth": 1,
"targets": [
{
"alias": "$tag_http_status_code",
"dsType": "influxdb",
"groupBy": [
{
"params": [
"http_status_code"
],
"type": "tag"
}
],
"measurement": "application.httprequests__errors",
"policy": "default",
"refId": "A",
"resultFormat": "time_series",
"select": [
[
{
"params": [
"value"
],
"type": "field"
},
{
"params": [],
"type": "sum"
}
]
],
"tags": [
{
"key": "app",
"operator": "=~",
"value": "/^$application$/"
},
{
"condition": "AND",
"key": "env",
"operator": "=~",
"value": "/^$environment$/"
},
{
"condition": "AND",
"key": "server",
"operator": "=~",
"value": "/^$server$/"
}
]
}
],
"title": "错误",
"type": "grafana-piechart-panel",
"valueName": "current"
},
{
"columns": [
{
"text": "Total",
"value": "total"
}
],
"datasource": "$datasource",
"editable": true,
"error": false,
"filterNull": true,
"fontSize": "100%",
"id": 24,
"interval": "",
"links": [],
"pageSize": 20,
"scroll": true,
"showHeader": true,
"sort": {
"col": 1,
"desc": true
},
"span": 7,
"styles": [
{
"dateFormat": "YYYY-MM-DD HH:mm:ss",
"pattern": "Time",
"type": "date"
},
{
"colorMode": null,
"colors": [
"rgba(245, 54, 54, 0.9)",
"rgba(237, 129, 40, 0.89)",
"rgba(50, 172, 45, 0.97)"
],
"decimals": 0,
"pattern": "/.*/",
"thresholds": [],
"type": "number",
"unit": "none"
}
],
"targets": [
{
"alias": "$tag_exception",
"dsType": "influxdb",
"groupBy": [
{
"params": [
"$interval"
],
"type": "time"
},
{
"params": [
"exception"
],
"type": "tag"
}
],
"measurement": "application.httprequests__exceptions",
"policy": "default",
"refId": "A",
"resultFormat": "time_series",
"select": [
[
{
"params": [
"value"
],
"type": "field"
},
{
"params": [],
"type": "last"
}
]
],
"tags": [
{
"key": "env",
"operator": "=~",
"value": "/^$environment$/"
},
{
"condition": "AND",
"key": "app",
"operator": "=~",
"value": "/^$application$/"
},
{
"condition": "AND",
"key": "server",
"operator": "=~",
"value": "/^$server$/"
}
]
}
],
"title": "未捕获的异常抛出",
"transform": "timeseries_aggregations",
"type": "table"
}
],
"repeat": null,
"repeatIteration": null,
"repeatRowId": null,
"showTitle": true,
"title": "概览",
"titleSize": "h6"
},
{
"collapse": false,
"height": "300",
"panels": [
{
"aliasColors": {},
"bars": false,
"datasource": "$datasource",
"editable": true,
"error": false,
"fill": 1,
"height": "350",
"id": 16,
"interval": "$summarize",
"legend": {
"alignAsTable": true,
"avg": false,
"current": false,
"max": false,
"min": false,
"rightSide": true,
"show": true,
"sort": "current",
"sortDesc": true,
"total": false,
"values": false
},
"lines": true,
"linewidth": 1,
"links": [],
"nullPointMode": "connected",
"percentage": false,
"pointradius": 5,
"points": false,
"renderer": "flot",
"seriesOverrides": [],
"span": 6,
"stack": true,
"steppedLine": false,
"targets": [
{
"alias": "$tag_route",
"dsType": "influxdb",
"groupBy": [
{
"params": [
"$interval"
],
"type": "time"
},
{
"params": [
"route"
],
"type": "tag"
},
{
"params": [
"null"
],
"type": "fill"
}
],
"measurement": "application.httprequests__transactions_per_endpoint",
"policy": "default",
"refId": "A",
"resultFormat": "time_series",
"select": [
[
{
"params": [
"rate1m"
],
"type": "field"
},
{
"params": [],
"type": "last"
}
]
],
"tags": [
{
"key": "env",
"operator": "=~",
"value": "/^$environment$/"
},
{
"condition": "AND",
"key": "app",
"operator": "=~",
"value": "/^$application$/"
},
{
"condition": "AND",
"key": "server",
"operator": "=~",
"value": "/^$server$/"
}
]
}
],
"thresholds": [],
"timeFrom": null,
"timeShift": null,
"title": "吞吐量 / Endpoint",
"tooltip": {
"msResolution": false,
"shared": true,
"sort": 2,
"value_type": "individual"
},
"transparent": false,
"type": "graph",
"xaxis": {
"mode": "time",
"name": null,
"show": true,
"values": []
},
"yaxes": [
{
"format": "rpm",
"label": null,
"logBase": 1,
"max": null,
"min": null,
"show": true
},
{
"format": "short",
"label": null,
"logBase": 1,
"max": null,
"min": null,
"show": true
}
]
},
{
"aliasColors": {},
"bars": false,
"datasource": "$datasource",
"editable": true,
"error": false,
"fill": 1,
"height": "350",
"id": 17,
"interval": "$summarize",
"legend": {
"alignAsTable": true,
"avg": false,
"current": false,
"max": false,
"min": false,
"rightSide": true,
"show": true,
"total": false,
"values": false
},
"lines": true,
"linewidth": 1,
"links": [],
"nullPointMode": "connected",
"percentage": false,
"pointradius": 5,
"points": false,
"renderer": "flot",
"seriesOverrides": [],
"span": 6,
"stack": false,
"steppedLine": false,
"targets": [
{
"alias": "$tag_route",
"dsType": "influxdb",
"groupBy": [
{
"params": [
"$interval"
],
"type": "time"
},
{
"params": [
"route"
],
"type": "tag"
},
{
"params": [
"null"
],
"type": "fill"
}
],
"measurement": "application.httprequests__transactions_per_endpoint",
"policy": "default",
"refId": "A",
"resultFormat": "time_series",
"select": [
[
{
"params": [
"p95"
],
"type": "field"
},
{
"params": [],
"type": "last"
},
{
"params": [
"95th Percentile"
],
"type": "alias"
}
]
],
"tags": [
{
"key": "env",
"operator": "=~",
"value": "/^$environment$/"
},
{
"condition": "AND",
"key": "app",
"operator": "=~",
"value": "/^$application$/"
},
{
"condition": "AND",
"key": "server",
"operator": "=~",
"value": "/^$server$/"
}
]
}
],
"thresholds": [],
"timeFrom": null,
"timeShift": null,
"title": "响应时间 / Endpoint",
"tooltip": {
"msResolution": false,
"shared": true,
"sort": 0,
"value_type": "individual"
},
"type": "graph",
"xaxis": {
"mode": "time",
"name": null,
"show": true,
"values": []
},
"yaxes": [
{
"format": "ms",
"label": null,
"logBase": 1,
"max": null,
"min": null,
"show": true
},
{
"format": "short",
"label": null,
"logBase": 1,
"max": null,
"min": null,
"show": true
}
]
},
{
"columns": [
{
"text": "Current",
"value": "current"
}
],
"datasource": "$datasource",
"editable": true,
"error": false,
"filterNull": false,
"fontSize": "100%",
"id": 10,
"interval": "",
"links": [],
"pageSize": null,
"scroll": true,
"showHeader": true,
"sort": {
"col": 1,
"desc": true
},
"span": 6,
"styles": [
{
"dateFormat": "YYYY-MM-DD HH:mm:ss",
"pattern": "Time",
"type": "date"
},
{
"colorMode": null,
"colors": [
"rgba(245, 54, 54, 0.9)",
"rgba(237, 129, 40, 0.89)",
"rgba(50, 172, 45, 0.97)"
],
"decimals": 2,
"pattern": "/.*/",
"thresholds": [],
"type": "number",
"unit": "ms"
}
],
"targets": [
{
"alias": "$tag_route",
"dsType": "influxdb",
"groupBy": [
{
"params": [
"$interval"
],
"type": "time"
},
{
"params": [
"route"
],
"type": "tag"
},
{
"params": [
"null"
],
"type": "fill"
}
],
"measurement": "application.httprequests__transactions_per_endpoint",
"policy": "default",
"refId": "A",
"resultFormat": "time_series",
"select": [
[
{
"params": [
"p95"
],
"type": "field"
},
{
"params": [],
"type": "last"
}
]
],
"tags": [
{
"key": "env",
"operator": "=~",
"value": "/^$environment$/"
},
{
"condition": "AND",
"key": "app",
"operator": "=~",
"value": "/^$application$/"
},
{
"condition": "AND",
"key": "server",
"operator": "=~",
"value": "/^$server$/"
}
]
}
],
"title": "响应时间 / Endpoint",
"transform": "timeseries_aggregations",
"type": "table"
},
{
"columns": [
{
"text": "Current",
"value": "current"
}
],
"datasource": "$datasource",
"editable": true,
"error": false,
"filterNull": false,
"fontSize": "100%",
"id": 12,
"interval": "",
"links": [],
"pageSize": null,
"scroll": true,
"showHeader": true,
"sort": {
"col": 1,
"desc": true
},
"span": 6,
"styles": [
{
"dateFormat": "YYYY-MM-DD HH:mm:ss",
"pattern": "Time",
"type": "date"
},
{
"colorMode": null,
"colors": [
"rgba(245, 54, 54, 0.9)",
"rgba(237, 129, 40, 0.89)",
"rgba(50, 172, 45, 0.97)"
],
"decimals": 2,
"pattern": "/.*/",
"thresholds": [],
"type": "number",
"unit": "rpm"
}
],
"targets": [
{
"alias": "$tag_route",
"dsType": "influxdb",
"groupBy": [
{
"params": [
"$interval"
],
"type": "time"
},
{
"params": [
"route"
],
"type": "tag"
},
{
"params": [
"null"
],
"type": "fill"
}
],
"measurement": "application.httprequests__transactions_per_endpoint",
"policy": "default",
"refId": "A",
"resultFormat": "time_series",
"select": [
[
{
"params": [
"rate1m"
],
"type": "field"
},
{
"params": [],
"type": "last"
}
]
],
"tags": [
{
"key": "env",
"operator": "=~",
"value": "/^$environment$/"
},
{
"condition": "AND",
"key": "app",
"operator": "=~",
"value": "/^$application$/"
},
{
"condition": "AND",
"key": "server",
"operator": "=~",
"value": "/^$server$/"
}
]
}
],
"title": "吞吐量 / Endpoint",
"transform": "timeseries_aggregations",
"type": "table"
},
{
"columns": [
{
"text": "Current",
"value": "current"
}
],
"datasource": "$datasource",
"editable": true,
"error": false,
"filterNull": false,
"fontSize": "100%",
"id": 11,
"interval": "",
"links": [],
"pageSize": null,
"scroll": true,
"showHeader": true,
"sort": {
"col": null,
"desc": false
},
"span": 6,
"styles": [
{
"dateFormat": "YYYY-MM-DD HH:mm:ss",
"pattern": "Time",
"type": "date"
},
{
"colorMode": null,
"colors": [
"rgba(245, 54, 54, 0.9)",
"rgba(237, 129, 40, 0.89)",
"rgba(50, 172, 45, 0.97)"
],
"decimals": 0,
"pattern": "/.*/",
"thresholds": [],
"type": "number",
"unit": "percent"
}
],
"targets": [
{
"alias": "$tag_route",
"dsType": "influxdb",
"groupBy": [
{
"params": [
"$interval"
],
"type": "time"
},
{
"params": [
"route"
],
"type": "tag"
},
{
"params": [
"null"
],
"type": "fill"
}
],
"measurement": "application.httprequests__one_minute_error_percentage_rate_per_endpoint",
"policy": "default",
"refId": "A",
"resultFormat": "time_series",
"select": [
[
{
"params": [
"value"
],
"type": "field"
},
{
"params": [],
"type": "last"
}
]
],
"tags": [
{
"key": "app",
"operator": "=~",
"value": "/^$application$/"
},
{
"condition": "AND",
"key": "env",
"operator": "=~",
"value": "/^$environment$/"
},
{
"condition": "AND",
"key": "server",
"operator": "=~",
"value": "/^$server$/"
}
]
}
],
"title": "错误请求的比例 / Endpoint",
"transform": "timeseries_aggregations",
"type": "table"
},
{
"columns": [
{
"text": "Total",
"value": "total"
}
],
"datasource": "$datasource",
"editable": true,
"error": false,
"filterNull": false,
"fontSize": "100%",
"id": 25,
"interval": "",
"links": [],
"pageSize": null,
"scroll": true,
"showHeader": true,
"sort": {
"col": 1,
"desc": true
},
"span": 6,
"styles": [
{
"dateFormat": "YYYY-MM-DD HH:mm:ss",
"pattern": "Time",
"type": "date"
},
{
"colorMode": null,
"colors": [
"rgba(245, 54, 54, 0.9)",
"rgba(237, 129, 40, 0.89)",
"rgba(50, 172, 45, 0.97)"
],
"decimals": 0,
"pattern": "/.*/",
"thresholds": [],
"type": "number",
"unit": "none"
}
],
"targets": [
{
"alias": "$tag_route [$tag_exception]",
"dsType": "influxdb",
"groupBy": [
{
"params": [
"$interval"
],
"type": "time"
},
{
"params": [
"route"
],
"type": "tag"
},
{
"params": [
"exception"
],
"type": "tag"
}
],
"measurement": "application.httprequests__exceptions",
"policy": "default",
"refId": "A",
"resultFormat": "time_series",
"select": [
[
{
"params": [
"value"
],
"type": "field"
},
{
"params": [],
"type": "last"
}
]
],
"tags": [
{
"key": "env",
"operator": "=~",
"value": "/^$environment$/"
},
{
"condition": "AND",
"key": "app",
"operator": "=~",
"value": "/^$application$/"
},
{
"condition": "AND",
"key": "server",
"operator": "=~",
"value": "/^$server$/"
}
]
}
],
"title": "未捕获的异常抛出 / Endpoint",
"transform": "timeseries_aggregations",
"type": "table"
}
],
"repeat": null,
"repeatIteration": null,
"repeatRowId": null,
"showTitle": true,
"title": "Endpoints",
"titleSize": "h6"
},
{
"collapse": false,
"height": "250",
"panels": [
{
"columns": [
{
"text": "Current",
"value": "current"
}
],
"datasource": "$datasource",
"editable": true,
"error": false,
"filterNull": false,
"fontSize": "100%",
"hideTimeOverride": true,
"id": 22,
"interval": "",
"links": [],
"pageSize": null,
"scroll": true,
"showHeader": true,
"sort": {
"col": 0,
"desc": true
},
"span": 9,
"styles": [
{
"dateFormat": "YYYY-MM-DD HH:mm:ss",
"pattern": "Time",
"type": "date"
},
{
"colorMode": "row",
"colors": [
"rgba(245, 54, 54, 0.9)",
"rgba(237, 129, 40, 0.89)",
"rgba(50, 172, 45, 0.97)"
],
"decimals": 1,
"pattern": "/.*/",
"thresholds": [
"0.5",
"1"
],
"type": "number",
"unit": "short"
}
],
"targets": [
{
"alias": "$tag_health_check_name",
"dsType": "influxdb",
"groupBy": [
{
"params": [
"$interval"
],
"type": "time"
},
{
"params": [
"health_check_name"
],
"type": "tag"
},
{
"params": [
"null"
],
"type": "fill"
}
],
"measurement": "application.health__results",
"policy": "default",
"refId": "A",
"resultFormat": "time_series",
"select": [
[
{
"params": [
"value"
],
"type": "field"
},
{
"params": [],
"type": "last"
}
]
],
"tags": [
{
"key": "env",
"operator": "=~",
"value": "/^$environment$/"
},
{
"condition": "AND",
"key": "app",
"operator": "=~",
"value": "/^$application$/"
},
{
"condition": "AND",
"key": "server",
"operator": "=~",
"value": "/^$server$/"
}
]
}
],
"timeFrom": null,
"title": "Results",
"transform": "timeseries_aggregations",
"transparent": true,
"type": "table"
},
{
"cacheTimeout": null,
"colorBackground": true,
"colorValue": false,
"colors": [
"rgba(245, 54, 54, 0.9)",
"rgba(237, 129, 40, 0.89)",
"rgba(50, 172, 45, 0.97)"
],
"datasource": "$datasource",
"editable": true,
"error": false,
"format": "none",
"gauge": {
"maxValue": 100,
"minValue": 0,
"show": false,
"thresholdLabels": false,
"thresholdMarkers": true
},
"hideTimeOverride": true,
"id": 19,
"interval": null,
"links": [
{
"type": "dashboard"
}
],
"mappingType": 2,
"mappingTypes": [
{
"name": "value to text",
"value": 1
},
{
"name": "range to text",
"value": 2
}
],
"maxDataPoints": 100,
"nullPointMode": "connected",
"nullText": null,
"postfix": "",
"postfixFontSize": "50%",
"prefix": "",
"prefixFontSize": "50%",
"rangeMaps": [
{
"from": "0",
"text": "Unhealthy",
"to": "0.49"
},
{
"from": "0.5",
"text": "Degraded",
"to": "0.9"
},
{
"from": "1.0",
"text": "Healthy",
"to": "2.0"
}
],
"span": 3,
"sparkline": {
"fillColor": "rgba(31, 118, 189, 0.18)",
"full": false,
"lineColor": "rgb(31, 120, 193)",
"show": false
},
"targets": [
{
"dsType": "influxdb",
"groupBy": [
{
"params": [
"$interval"
],
"type": "time"
},
{
"params": [
"null"
],
"type": "fill"
}
],
"measurement": "application.health__score",
"policy": "default",
"refId": "A",
"resultFormat": "time_series",
"select": [
[
{
"params": [
"value"
],
"type": "field"
},
{
"params": [],
"type": "last"
}
]
],
"tags": [
{
"key": "env",
"operator": "=~",
"value": "/^$environment$/"
},
{
"condition": "AND",
"key": "app",
"operator": "=~",
"value": "/^$application$/"
},
{
"condition": "AND",
"key": "server",
"operator": "=~",
"value": "/^$server$/"
}
]
}
],
"thresholds": "0.5,1",
"timeFrom": null,
"title": "",
"transparent": true,
"type": "singlestat",
"valueFontSize": "80%",
"valueMaps": [
{
"op": "=",
"text": "Unhealthy",
"value": "0"
},
{
"op": "=",
"text": "Degraded",
"value": "0.5"
},
{
"op": "=",
"text": "Healthy",
"value": "1.0"
}
],
"valueName": "current"
}
],
"repeat": null,
"repeatIteration": null,
"repeatRowId": null,
"showTitle": true,
"title": "Health",
"titleSize": "h6"
},
{
"collapse": false,
"height": "300",
"panels": [
{
"aliasColors": {},
"bars": false,
"datasource": "$datasource",
"editable": true,
"error": false,
"fill": 1,
"id": 14,
"interval": "$summarize",
"legend": {
"alignAsTable": true,
"avg": false,
"current": true,
"hideEmpty": false,
"max": false,
"min": false,
"rightSide": true,
"show": true,
"total": false,
"values": true
},
"lines": true,
"linewidth": 1,
"links": [],
"nullPointMode": "connected",
"percentage": false,
"pointradius": 5,
"points": false,
"renderer": "flot",
"seriesOverrides": [],
"span": 6,
"stack": false,
"steppedLine": false,
"targets": [
{
"alias": "$col",
"dsType": "influxdb",
"groupBy": [
{
"params": [
"$interval"
],
"type": "time"
},
{
"params": [
"null"
],
"type": "fill"
}
],
"measurement": "application.httprequests__post_size",
"policy": "default",
"refId": "A",
"resultFormat": "time_series",
"select": [
[
{
"params": [
"p95"
],
"type": "field"
},
{
"params": [],
"type": "last"
},
{
"params": [
"95th percentile"
],
"type": "alias"
}
],
[
{
"params": [
"p98"
],
"type": "field"
},
{
"params": [],
"type": "last"
},
{
"params": [
"98th percentile"
],
"type": "alias"
}
],
[
{
"params": [
"p99"
],
"type": "field"
},
{
"params": [],
"type": "last"
},
{
"params": [
"99th percentile"
],
"type": "alias"
}
],
[
{
"params": [
"last"
],
"type": "field"
},
{
"params": [],
"type": "median"
},
{
"params": [
"median"
],
"type": "alias"
}
]
],
"tags": [
{
"key": "app",
"operator": "=~",
"value": "/^$application$/"
},
{
"condition": "AND",
"key": "env",
"operator": "=~",
"value": "/^$environment$/"
},
{
"condition": "AND",
"key": "server",
"operator": "=~",
"value": "/^$server$/"
}
]
}
],
"thresholds": [],
"timeFrom": null,
"timeShift": null,
"title": "Post Request Size",
"tooltip": {
"msResolution": false,
"shared": true,
"sort": 0,
"value_type": "individual"
},
"type": "graph",
"xaxis": {
"mode": "time",
"name": null,
"show": true,
"values": []
},
"yaxes": [
{
"format": "decbytes",
"label": null,
"logBase": 1,
"max": null,
"min": null,
"show": true
},
{
"format": "short",
"label": null,
"logBase": 1,
"max": null,
"min": null,
"show": true
}
]
},
{
"aliasColors": {},
"bars": false,
"datasource": "$datasource",
"editable": true,
"error": false,
"fill": 1,
"id": 15,
"interval": "$summarize",
"legend": {
"alignAsTable": true,
"avg": false,
"current": true,
"max": false,
"min": false,
"rightSide": true,
"show": true,
"total": false,
"values": true
},
"lines": true,
"linewidth": 1,
"links": [],
"nullPointMode": "connected",
"percentage": false,
"pointradius": 5,
"points": false,
"renderer": "flot",
"seriesOverrides": [],
"span": 6,
"stack": false,
"steppedLine": false,
"targets": [
{
"alias": "$col",
"dsType": "influxdb",
"groupBy": [
{
"params": [
"$interval"
],
"type": "time"
},
{
"params": [
"null"
],
"type": "fill"
}
],
"measurement": "application.httprequests__put_size",
"policy": "default",
"refId": "A",
"resultFormat": "time_series",
"select": [
[
{
"params": [
"p95"
],
"type": "field"
},
{
"params": [],
"type": "last"
},
{
"params": [
"95th percentile"
],
"type": "alias"
}
],
[
{
"params": [
"p98"
],
"type": "field"
},
{
"params": [],
"type": "last"
},
{
"params": [
"98th percentile"
],
"type": "alias"
}
],
[
{
"params": [
"p99"
],
"type": "field"
},
{
"params": [],
"type": "last"
},
{
"params": [
"99th percentile"
],
"type": "alias"
}
],
[
{
"params": [
"median"
],
"type": "field"
},
{
"params": [],
"type": "median"
},
{
"params": [
"median"
],
"type": "alias"
}
]
],
"tags": [
{
"key": "app",
"operator": "=~",
"value": "/^$application$/"
},
{
"condition": "AND",
"key": "env",
"operator": "=~",
"value": "/^$environment$/"
},
{
"condition": "AND",
"key": "server",
"operator": "=~",
"value": "/^$server$/"
}
]
}
],
"thresholds": [],
"timeFrom": null,
"timeShift": null,
"title": "Put Request Size",
"tooltip": {
"msResolution": false,
"shared": true,
"sort": 0,
"value_type": "individual"
},
"type": "graph",
"xaxis": {
"mode": "time",
"name": null,
"show": true,
"values": []
},
"yaxes": [
{
"format": "bytes",
"label": null,
"logBase": 1,
"max": null,
"min": null,
"show": true
},
{
"format": "short",
"label": null,
"logBase": 1,
"max": null,
"min": null,
"show": true
}
]
}
],
"repeat": null,
"repeatIteration": null,
"repeatRowId": null,
"showTitle": true,
"title": "PUT & POST Request Size",
"titleSize": "h6"
}
],
"schemaVersion": 14,
"style": "dark",
"tags": [
"influxdb"
],
"templating": {
"list": [
{
"allValue": null,
"current": {},
"datasource": "$datasource",
"hide": 0,
"includeAll": false,
"label": null,
"multi": false,
"name": "environment",
"options": [],
"query": "SHOW TAG VALUES WITH KEY = \"env\"",
"refresh": 1,
"regex": "",
"sort": 1,
"tagValuesQuery": null,
"tags": [],
"tagsQuery": null,
"type": "query",
"useTags": false
},
{
"allValue": null,
"current": {},
"datasource": "$datasource",
"hide": 0,
"includeAll": false,
"label": null,
"multi": false,
"name": "application",
"options": [],
"query": "SHOW TAG VALUES WITH KEY = \"app\"",
"refresh": 1,
"regex": "",
"sort": 1,
"tagValuesQuery": null,
"tags": [],
"tagsQuery": null,
"type": "query",
"useTags": false
},
{
"current": {
"text": "AppMetricsSandbox",
"value": "AppMetricsSandbox"
},
"hide": 0,
"label": null,
"name": "datasource",
"options": [],
"query": "influxdb",
"refresh": 1,
"regex": "",
"type": "datasource"
},
{
"auto": false,
"auto_count": 30,
"auto_min": "10s",
"current": {
"text": "5s",
"value": "5s"
},
"hide": 0,
"label": null,
"name": "summarize",
"options": [
{
"selected": true,
"text": "5s",
"value": "5s"
},
{
"selected": false,
"text": "10s",
"value": "10s"
},
{
"selected": false,
"text": "30s",
"value": "30s"
},
{
"selected": false,
"text": "1m",
"value": "1m"
},
{
"selected": false,
"text": "10m",
"value": "10m"
},
{
"selected": false,
"text": "30m",
"value": "30m"
},
{
"selected": false,
"text": "1h",
"value": "1h"
},
{
"selected": false,
"text": "6h",
"value": "6h"
},
{
"selected": false,
"text": "12h",
"value": "12h"
},
{
"selected": false,
"text": "1d",
"value": "1d"
},
{
"selected": false,
"text": "7d",
"value": "7d"
},
{
"selected": false,
"text": "14d",
"value": "14d"
},
{
"selected": false,
"text": "30d",
"value": "30d"
}
],
"query": "5s,10s,30s,1m,10m,30m,1h,6h,12h,1d,7d,14d,30d",
"refresh": 2,
"type": "interval"
},
{
"allValue": null,
"current": {},
"datasource": "$datasource",
"hide": 0,
"includeAll": true,
"label": null,
"multi": true,
"name": "server",
"options": [],
"query": "SHOW TAG VALUES WITH KEY = \"server\"",
"refresh": 1,
"regex": "",
"sort": 0,
"tagValuesQuery": "",
"tags": [],
"tagsQuery": "",
"type": "query",
"useTags": false
}
]
},
"time": {
"from": "now-5m",
"to": "now"
},
"timepicker": {
"refresh_intervals": [
"5s",
"10s",
"30s",
"1m",
"5m",
"15m",
"30m",
"1h",
"2h",
"1d"
],
"time_options": [
"5m",
"15m",
"1h",
"6h",
"12h",
"24h",
"2d",
"7d",
"30d"
]
},
"timezone": "browser",
"title": "App Metrics - Web Monitoring - InfluxDB",
"version": 21
}- 本文链接:http://uncmd.github.io/microservice/metrics/
- 版权声明:本博客所有文章除特别声明外,均默认采用 许可协议。
若您想及时得到回复提醒,建议跳转 GitHub Issues 评论。
若没有本文 Issue,您可以使用 Comment 模版新建。
GitHub Issues